Skip to content
scDrugPerturb-Bench / Research paper

A mechanism-annotated benchmark reveals limited fidelity to drug-response signatures in single-cell perturbation models

Expression reconstruction is not mechanism recovery. scDrugPerturb-Bench is a virtual cell benchmark that links matched control and drug-treated single-cell RNA-seq profiles to literature-curated directional key-gene evidence, testing whether virtual-cell models recover the genes, pathways and response specificity that make drug predictions biologically actionable.

Simucella research programMindFlow.AIMechanism-aware evaluation
At a glance

Expression similarity does not imply mechanism fidelity.

A representative prediction looks excellent by expression reconstruction, yet reverses the entire known response programme.

T0901317 / human iPSC-derived microglia

The profile looks right. The mechanism is backwards.

0.0891MSE / 30 nM
0.0858MSE / 100 nM
0 / 8correct key-gene directions
T0901317 case study showing low MSE despite reversed predictions for ABCA1, ABCG1, APOE and ACSL1 at two doses.

ABCA1, ABCG1, APOE and ACSL1 should all increase. The model predicts the opposite direction for every gene at both doses.

What expression similarity misses

Six views of mechanism fidelity.

MFS asks which parts of the biological mechanism a prediction actually recovers.

Gene levelPCS
Principle diagram for Pattern Consistency Score.

Pattern Consistency

Do key genes change in the annotated direction?

Gene levelESR
Principle diagram for Effect Size Recovery.

Effect Size Recovery

Does the predicted magnitude match the measured effect?

Gene setGCS
Principle diagram for Gene-set Coherence Score.

Gene-set Coherence

Are mechanism genes recovered as a coordinated response?

Gene setMSS
Principle diagram for Mechanism Specificity Score.

Mechanism Specificity

Is the signal concentrated on mechanism-relevant genes?

Pathway levelPρ
Principle diagram for Pathway Spearman correlation.

Pathway Spearman

Are predicted and observed pathway profiles concordant?

Pathway levelPSA
Principle diagram for Pathway Sign Accuracy.

Pathway Sign Accuracy

Are activated and suppressed pathways assigned correctly?

The complement

MFS adds a biological question to the scorecard.

Traditional reconstruction metrics remain useful: they tell us whether the predicted profile resembles the measured response. MFS adds evidence that resemblance alone cannot provide.

Different signal

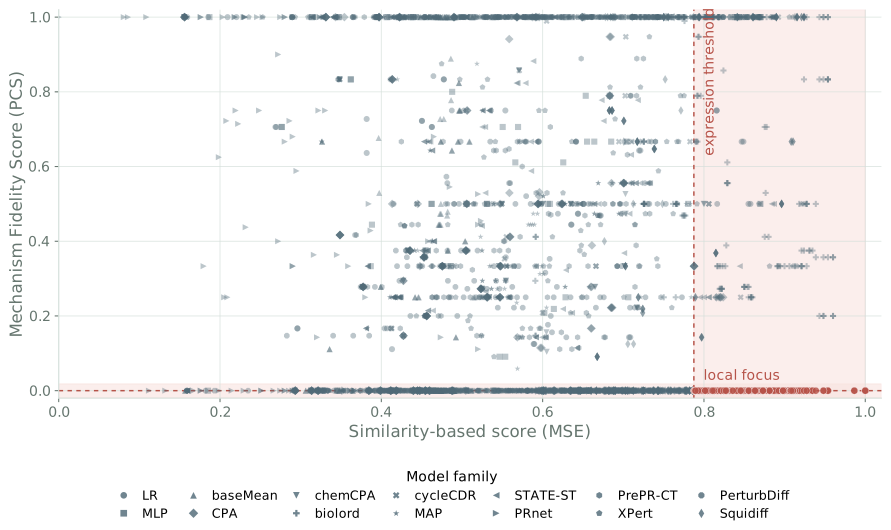
MFS is not reducible to expression similarity.

Correlations across the two metric families are mixed and often weak. A model can therefore score well on reconstruction without preserving the genes and pathways that define the mechanism.

MFS is an important complement, not a replacement.
Spearman correlation matrix comparing seven similarity-based metrics with five mechanism fidelity metrics.
Spearman correlations between traditional similarity-based metrics and mechanism fidelity metrics.
Scatter plot of MSE-derived expression similarity against Mechanism Fidelity Score, with a highlighted high-similarity and low-PCS region.
Coral points meet both thresholds.